
# 서버의 상태를 관리하기 위해 시스템 메트릭 모니터링을 구축한다.
서비스의 상태, 성능, 문제점을 시각적으로 표현하여 실시간으로 모니터링 할 수 있는 인터페이스를 구축하자
이를 통해 환경에서의 문제점을 식별할 수 있다.
# Methric 수집 및 통합 도구
1. Prometheus
- pull 방식으로 methric을 수집하여, 오픈소스이다.
- 많은 자료들이 존재하여 접근하기 쉽다.
- 시계열 DB를 사용한다
2. influx DB
- 오픈소스를 제공하고, Sass도 제공한다.
- 성능이 좋지만 자료가 적고 구성이 어렵다.
3. datadog
- SaaS제품으로 모니터링을 신경쓰지 않기 때문에 관리하기가 쉽다
- 다만 비용적인 측면이 존재한다.
여기서 Prometheus를 활용하여 시스템 메트릭 데이터를 수집 및 저장하고, Grafana를 통해 대시보드로 시각화 할 예정이다.
# 아키텍처
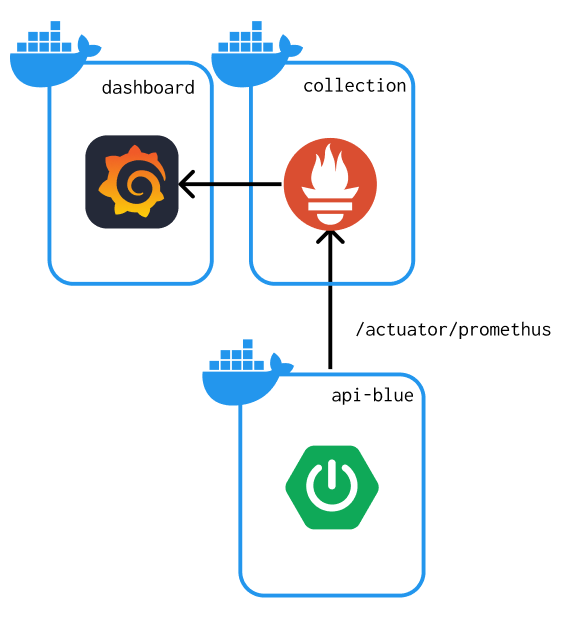
# 먼저 spring boot에서 actuator를 설정한다.
## actuator
https://docs.spring.io/spring-boot/reference/actuator/endpoints.html#actuator.endpoints
dependencies에 actuator를 설치한다.
## build.gradle
    // health-check
    implementation 'org.springframework.boot:spring-boot-starter-actuator'
    // 모니터링
    implementation 'io.micrometer:micrometer-registry-prometheus'
## application.yml 에서 endpoints를 열어준다
management:
  endpoints:
    web:
      exposure:
        include: health, beans, httpexchanges, info, metrics, prometheus
이렇게 설정하면 spring boot 설정은 완료되었다.
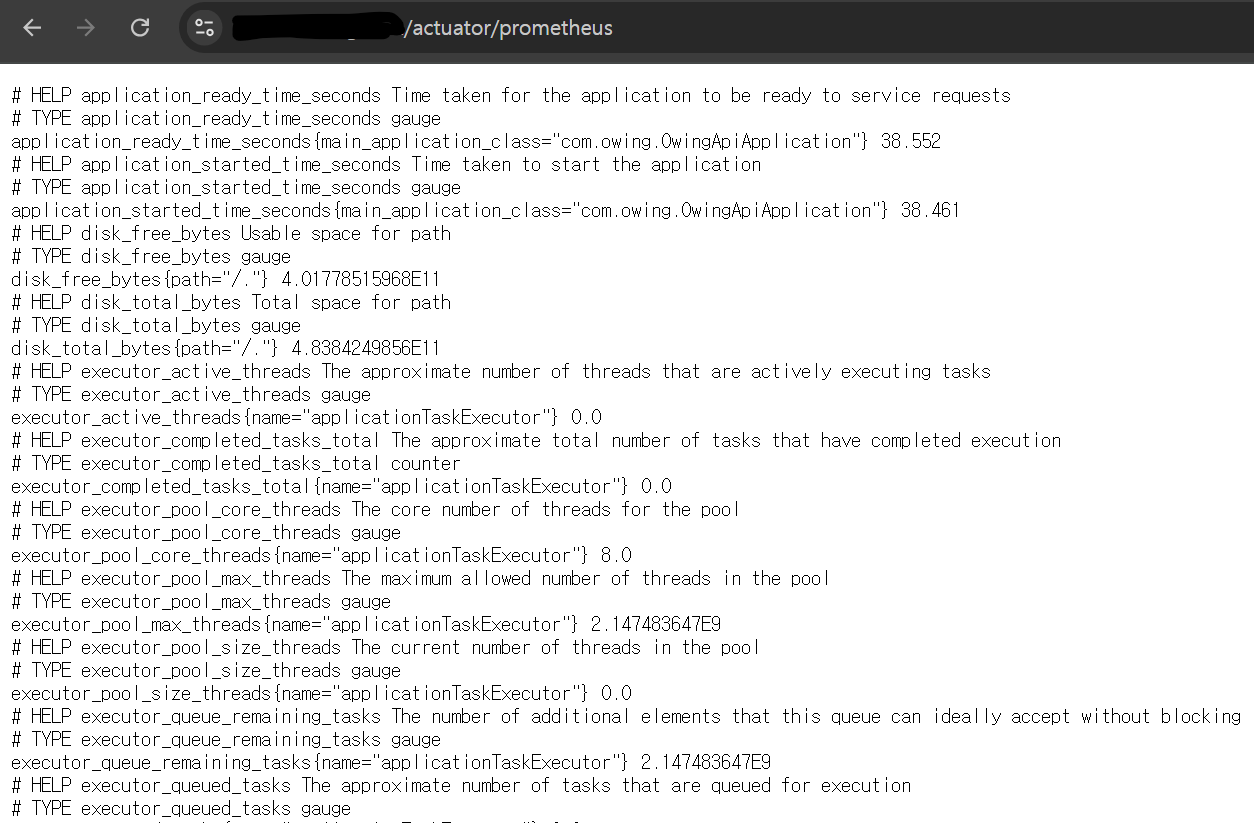
여기서 이제 prometheus는 server/actuator/prometheus 로 나오는 response를 통해 데이터를 가져온다.
## 데이터 확인
# Promethues와 Grafana 설정 (with Docker)
## 먼저 prometheus의 설정 파일을 생성한다.
필자는 prometheus/config/promethus.yml을 설정하였다.
# my global config
global:
  scrape_interval: 15s # Set the scrape interval to every 15 seconds. Default is every 1 minute.
  evaluation_interval: 15s # Evaluate rules every 15 seconds. The default is every 1 minute.
  # scrape_timeout is set to the global default (10s).

# Alertmanager configuration
alerting:
  alertmanagers:
    - static_configs:
        - targets:
          # - alertmanager:9093

# Load rules once and periodically evaluate them according to the global 'evaluation_interval'.
rule_files:
# - "first_rules.yml"
# - "second_rules.yml"

# A scrape configuration containing exactly one endpoint to scrape:
# Here it's Prometheus itself.
scrape_configs:
  # The job name is added as a label `job=<job_name>` to any timeseries scraped from this config.
  - job_name: "prometheus"

    # metrics_path defaults to '/metrics'
    # scheme defaults to 'http'.

    static_configs:
      - targets: ["localhost:9090"]
  - job_name: 'owing-backend-dev'
    scrape_interval: 15s
    metrics_path: '/actuator/prometheus'
    static_configs:
- targets: ['owing-backend-dev:8080']### static_config
promethus의 localhost 실행하고 있는 process 의 port이다.
### job_name
job_name은 프로메테우스에서 보여질 이름이고,
methric_pach를 통해 위에서 열어둔 endpoint의 데이터를 가져올 path를 설정한다.
targets 를 spring의 origin을 설정해주어야한다. 이때 같은 docker network이기 때문에 docker의 이름 뒤에 내부 port를 붙여 연결한다.
## 서버 인프라를 docker-compose.yml 설정
여기서 spring boot, promethus, grafana docker를 설정한다.
이 docker-compose.yml 의 파일 위치는 promethus 폴더와 같은 위치에 있으면 된다.
services:
  app:
    build:
      context: ../Owing-Api
      dockerfile: Dockerfile
    container_name: owing-backend-dev
    ports:
      - "8080:8080"
    env_file:
      - ../.env

  prometheus:
    image: prom/prometheus
    container_name: prometheus-container
    ports:
      - "8011:9090"
    volumes:
      - ./prometheus/config/prometheus.yml:/etc/prometheus/prometheus.yml
    command:
      - '--config.file=/etc/prometheus/prometheus.yml'

  grafana:
    image: grafana/grafana
    container_name: grafana-container
    ports:
      - "8012:3000"
    depends_on:
      - prometheus
    volumes:
      - ./grafana:/var/lib/grafana
    restart: always
그리고 docker-compose up -d 를 통해 모두 실행한다.
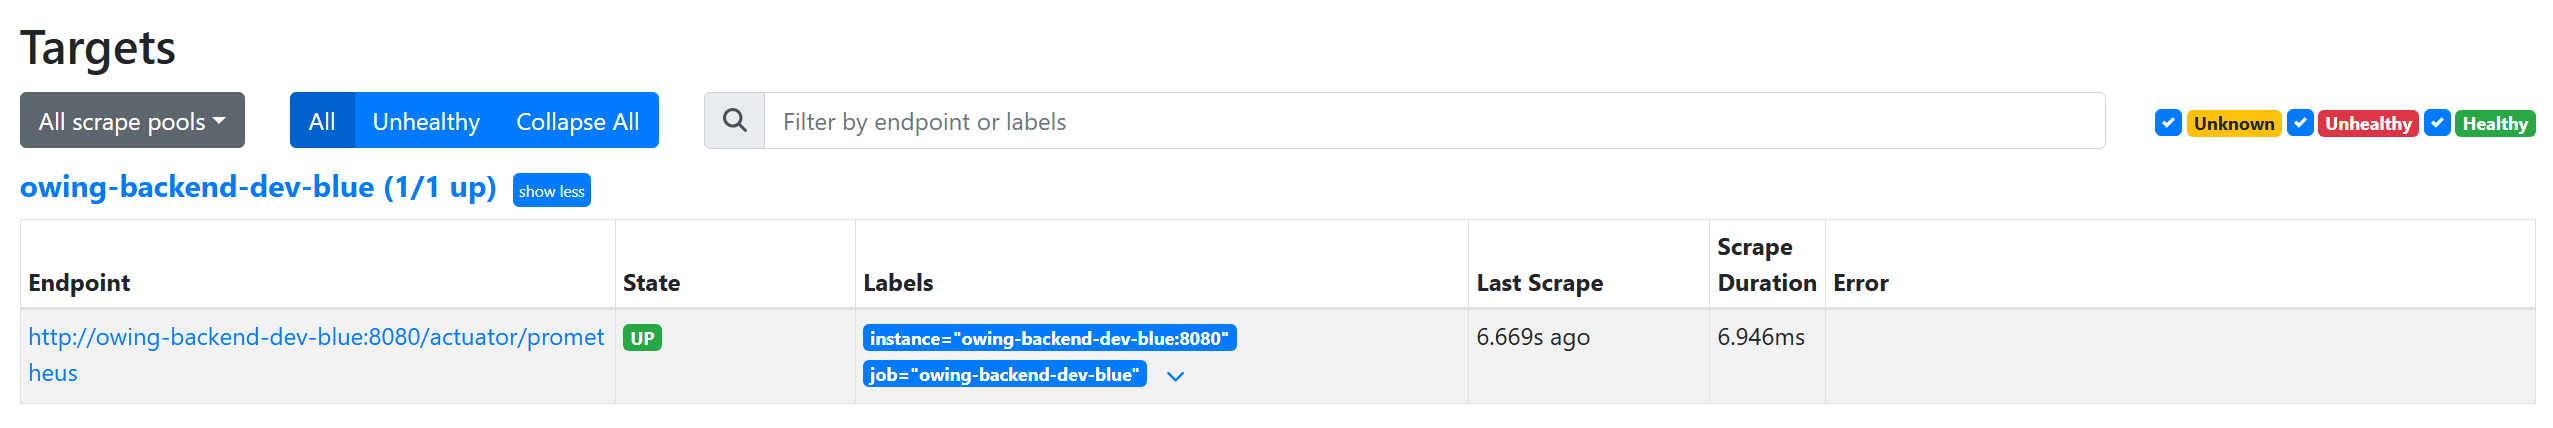
## promethus에서 연결되어 있는지 확인
localhost:8011/targets을 통해 프로메테우스에 접속한다.
이 때 연결한 spring 의 state가 보이면 잘 연결된 것이다!
## Grafana 연결
여기까지 왔다면 이제 시각화만 하면 된다.
localhost:8012로 접속해서 grafana에 접속하자
초기 아이디는 admin, 비번도 admin이다.
dashboard 탭에서 new를 누르고 import를 선택하자!
우리는 JVM(4701) 과 Promethus 2.0 Overview(3662)를 통해 시각화를 해볼 것이다.
### JVM dashboard
ID는 4701이다. 여기서 select a Prometheus를 선택하면된다. 없다면, 다음 과정을 따르자!
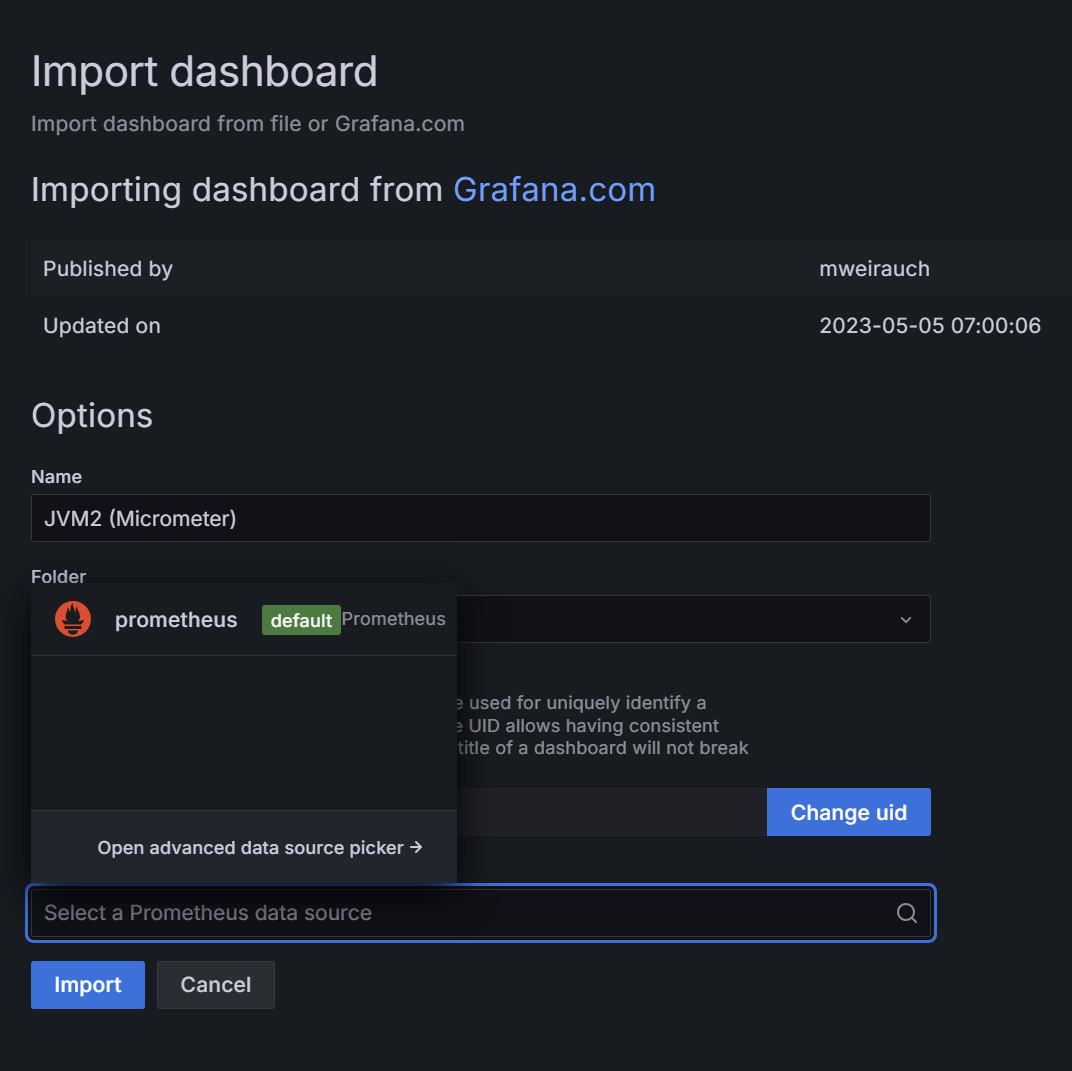
그리고 import를 누르면 성공이다!
### Prometheus 설정
database add를 선택하고 prometheus를 찾아 선택한다.
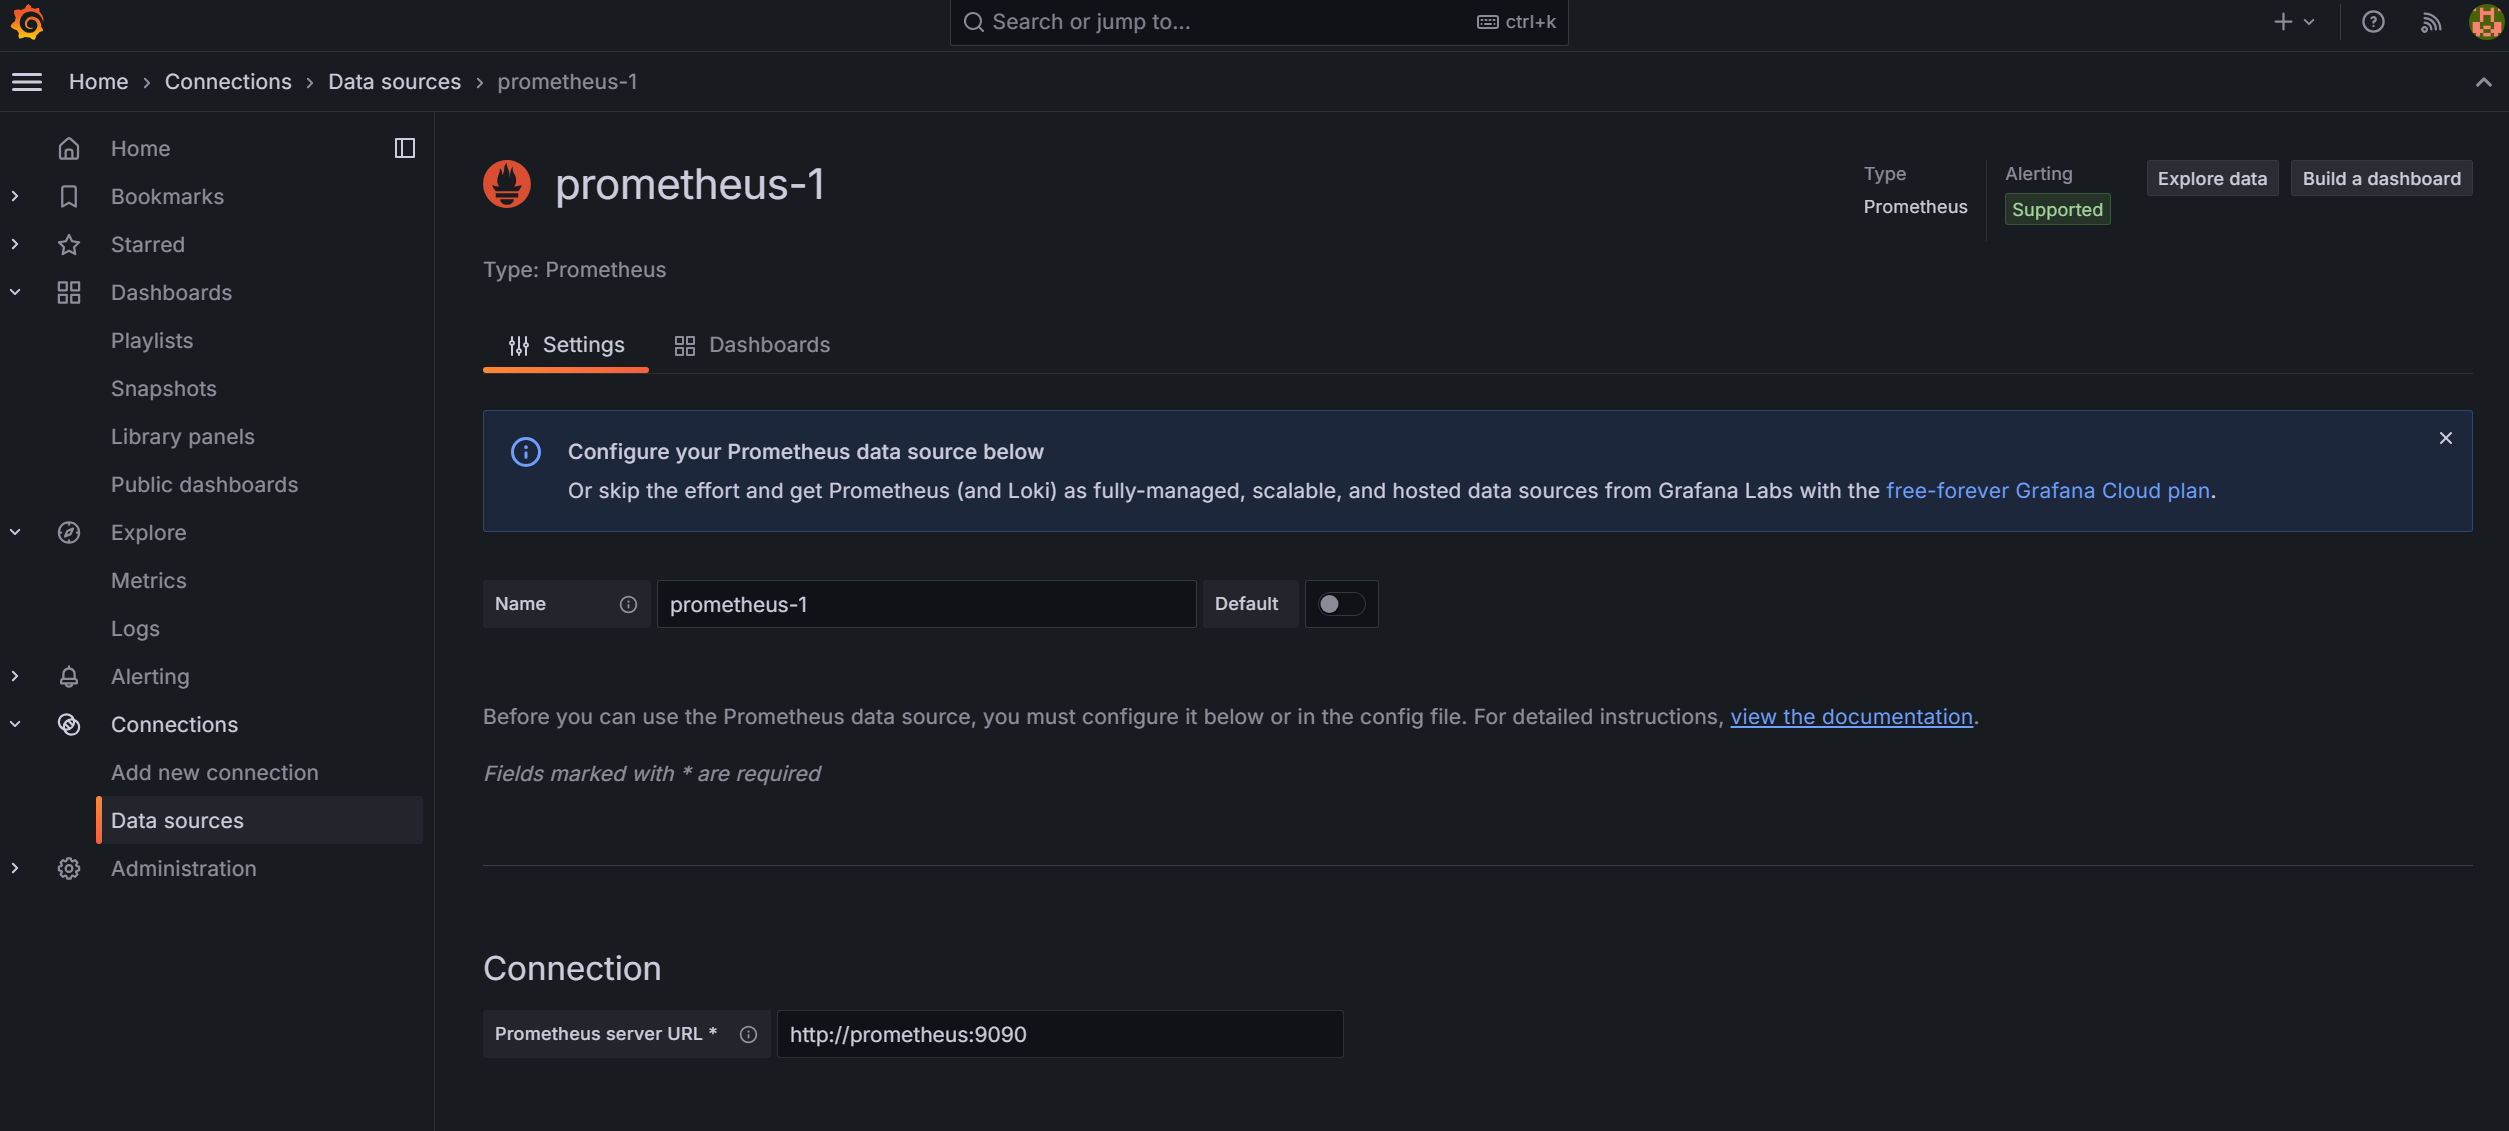
여기서 Connection을 채워야하는데, 같은 docker network 이니, 저는 prometheus:9090을 입력하여 연결한다.
여기서 test & connection을 클릭했을 때,
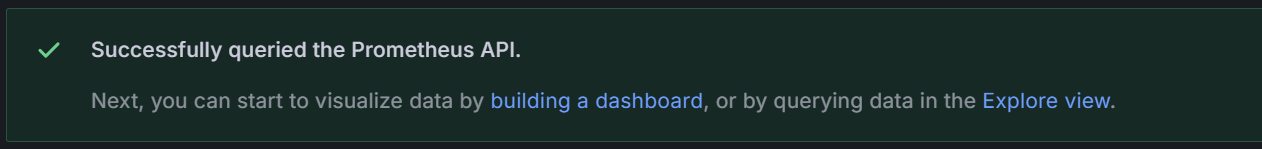
가 나오면 성공!
# 결과
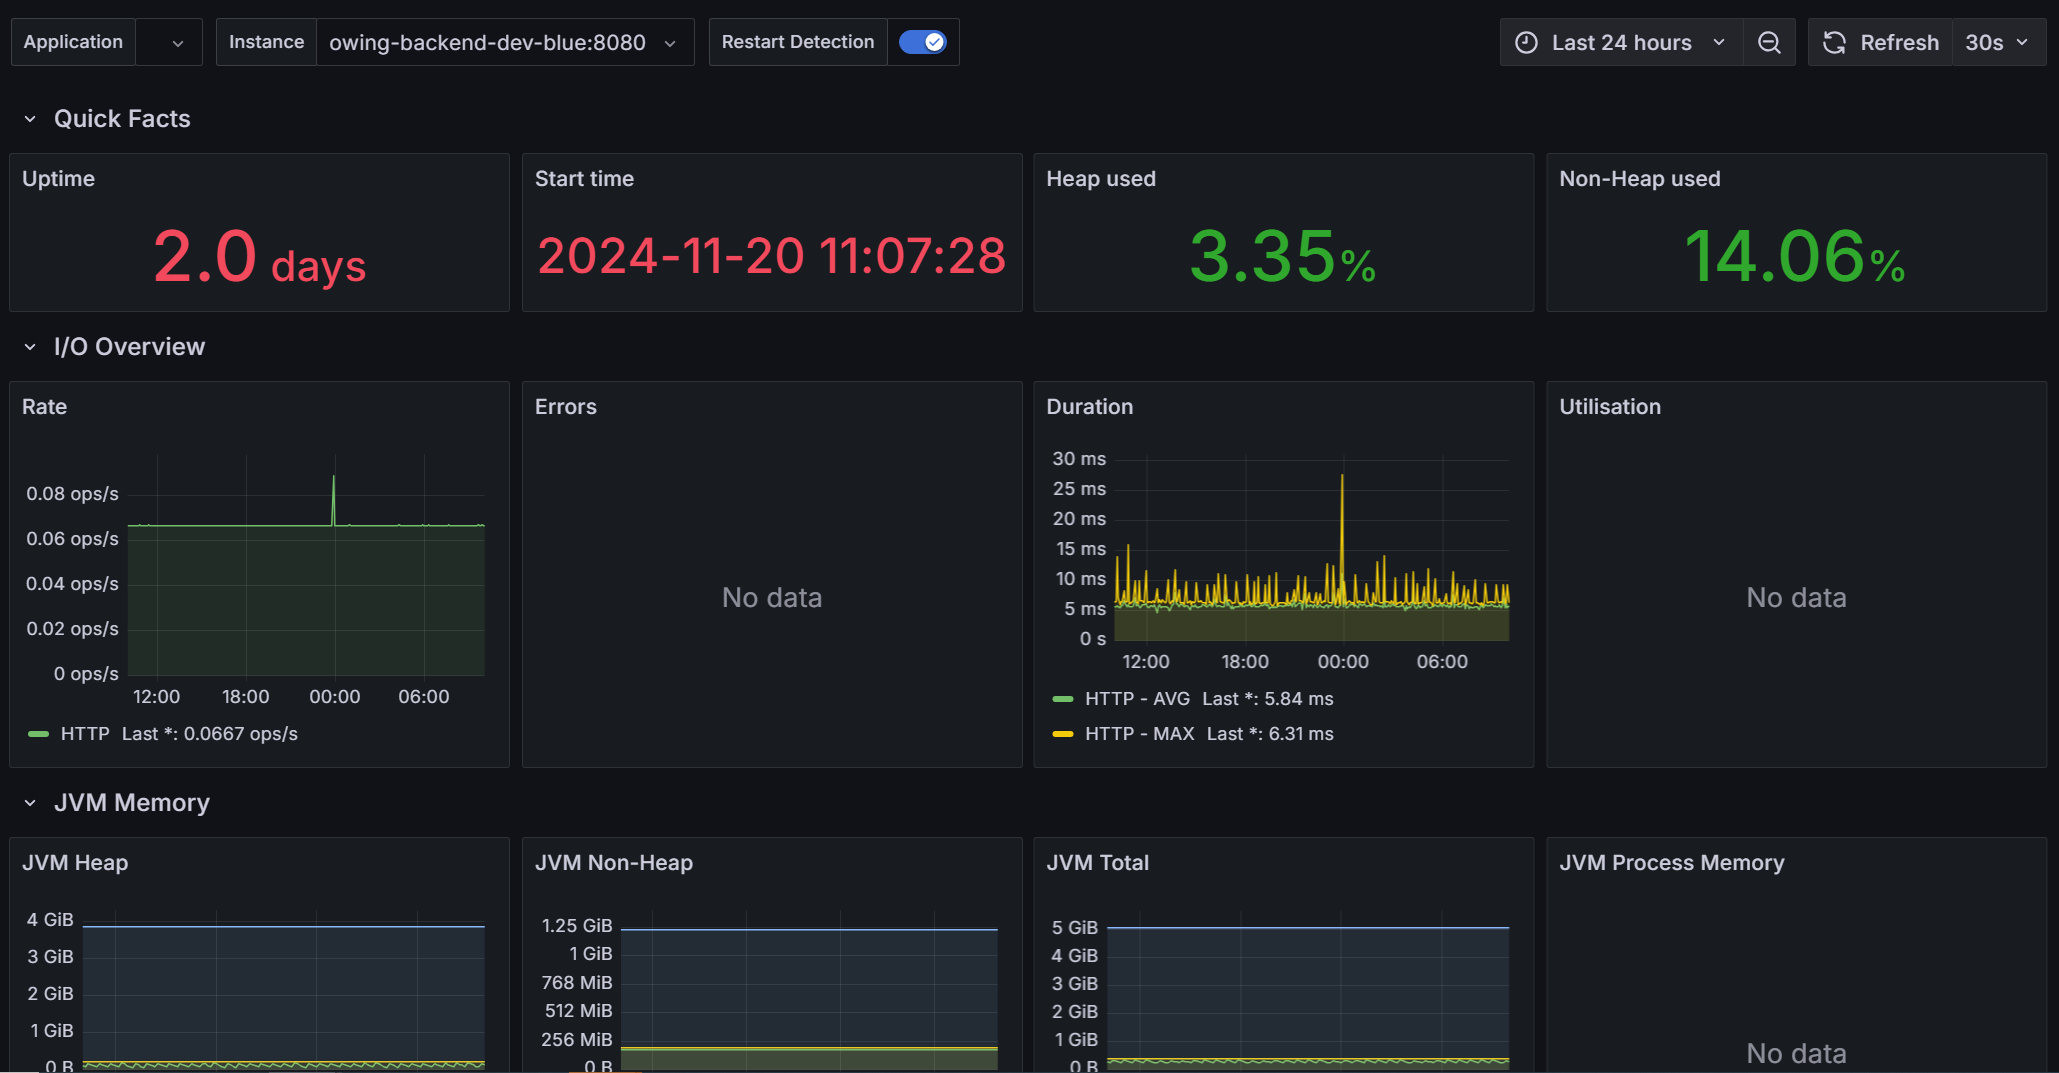
필자는 blue-green 무중단 배포를 활용하여 instance이름에 blue가 추가하였습니다.
# 출처
'Infra > 네트워크' 카테고리의 다른 글
| [Infra] 로깅 처리를 위한 ELK 설정 (with spring) (0) | 2024.11.22 |
|---|---|
| [Infra] 포워드 프록시와 리버스 프록시 차이점 (6) | 2024.10.19 |